The Container Leasing Industry continues to grow at a very good pace. The ecosystem around Container Leasing include Transportation (road), Shipping, Insurance, Depots among others. Shipping Industry is an essential and major contributor in the World Trade and Economy, Containers which are used by the Shipping Industry thus acquire a significant role in the trade. As with many other industries there was an impact on this industry due to Covid but post that it is revitalizing and the momentum of growth is picking up. Some experts estimate that it will touch $8 Billion dollars in the next couple of years.
Containers are leased by Shipping firms, Inland Transport firms, Corporates and Individuals. Most of such leasing is for transporting goods across countries and continents and a few for in-country / domestic transport or storage needs. Shipping Firms and Corporations may have their own containers however either for special needs or when the demand is high or for financial considerations they take containers for leasing.
Containers are of different types based on their Size (Length, Height), the Opening Side, Special features (such as refrigeration);
- A standard storage container typically 40ft long. Different types of this are 20ft length, Opening side (Front, Side and Top).
- A refrigerated container is typically used to transport food items which need a certain temperature to be maintained all during the point-to-point transport.
- Insulated Containers are used when there is a need to maintain a certain temperature even when transported through changing temperatures as well as to prevent contamination from strong winds and other such conditions.
Leasing Contracts are categorized based on the duration of the Contracts and the financing/payment terms. Typically, a contract is termed Short Term when the leasing duration is less than a year. If the Customer would buy out the Container at the end of the lease duration then it is called to Lease-to-Buy.
Leasing Process
The typical leasing process is as follows.
Based on the Marketing team’s efforts and Demand, the sales team negotiates the deal with potential customers. The Leasing Company and the Customer enter into a Contract which specifies the types of containers that the Customer will lease, the duration for which they will be leased, from which location the containers will be picked and the rental costs. The Container Leasing Schedule is an important part of the contract.
Basis the Contract the Customer will send his requirements from time to time – requirements that specify the number of Containers for each type and the location from where they will be picked up. This is termed as Booking. Basis the bookings the sales operations team will instruct respective depots about the handing over / transporting containers to the specific customers. This process is called Lease Out and the count of containers leased out is referred to as LOTs.
At the end of the lease duration of a standard leasing contract the Container is returned to any of the leasing company’s depots, not necessarily the depot from where it was picked up. The Customer will communicate to the sales operations the date and location where the container is being returned. The operations team will instruct the depot to receive the containers. The process of returning the container is called Turn In and the count of the returned containers is referred to as TINs.
The depots after receiving containers will get them inspected. In case of any damages the due process is followed to recover the damages from the insurance or the responsible parties based on the terms & conditions of the contract. Repairs are done to damaged containers. Based on the condition of the container a decision is taken either to sell it, bin it or to return it to the stock of available containers.
The standard size of a container is twenty feet. All other containers have sizes that can be typically expressed in multiples of twenty. For ease of computation and aggregation the counts of containers are always expressed as twenty foot equivalent units (TEU). In cases of finance they are expressed as cost equivalent unit (CEU) terms.
Analytics : Reports & Metrics
Analytics can provide a wide range of Reports and Metrics based on the Subject (say Client, Depot) and/or Function (say Marketing or Operations).
Client:
Key Insights provided by Analytics to the Marketing, Finance and Operations about Clients help them to determine how profitable a Client is and how stable the relationship with the Client is.
[wptb id=12636]Depot:
Key Insights provided by Analytics about the Depot Activity will help to determine the best performing depots which further enable smooth execution of business activities.
[wptb id=12639]Marketing:
Key Insights provided specifically for the Marketing function help in planning as well as managing sales and relationship
[wptb id=12640]Operations:
Key Insights will support and improve operational efficiencies.
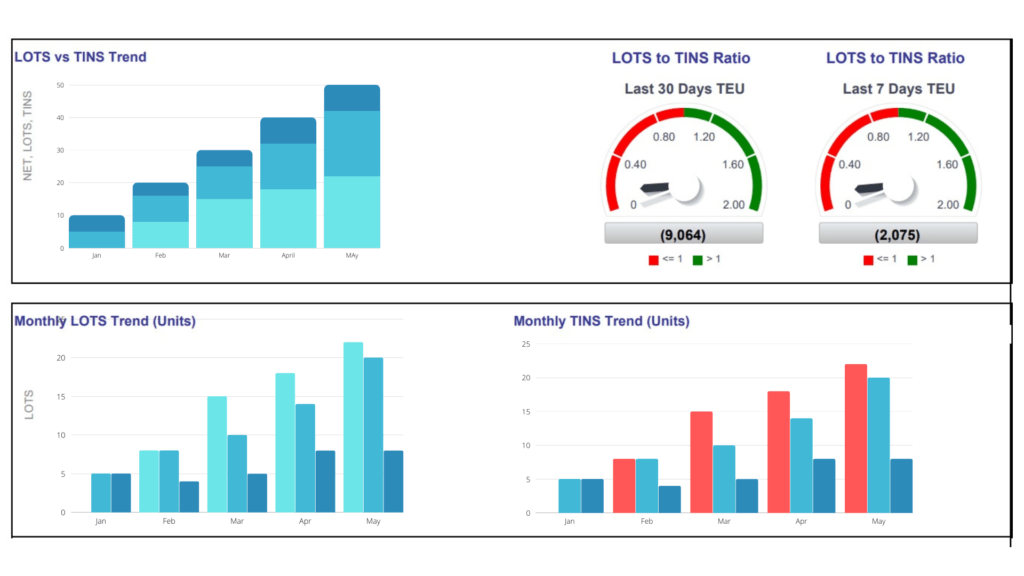
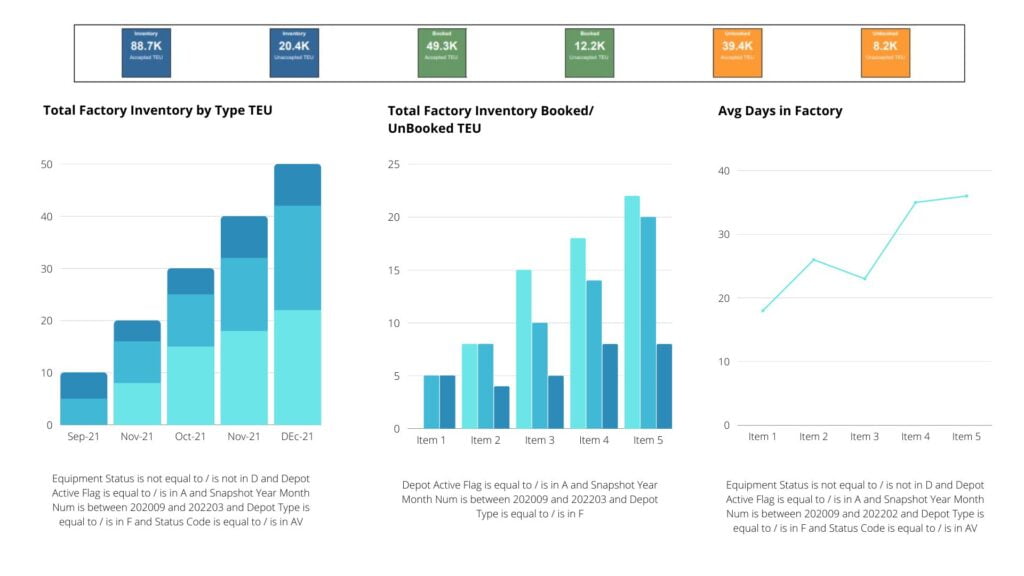
[wptb id=12641]Sample Dashboards
Below are couple of sample dashboards
Conclusion
Analytics will enable smooth functioning of the Container Leasing firms as well as support the growth by providing quality insights.
To know more details about the advantages of data analytics in the Container leasing industry contact us at [email protected].